How Modern Markets Broke the 60/40 Portfolio
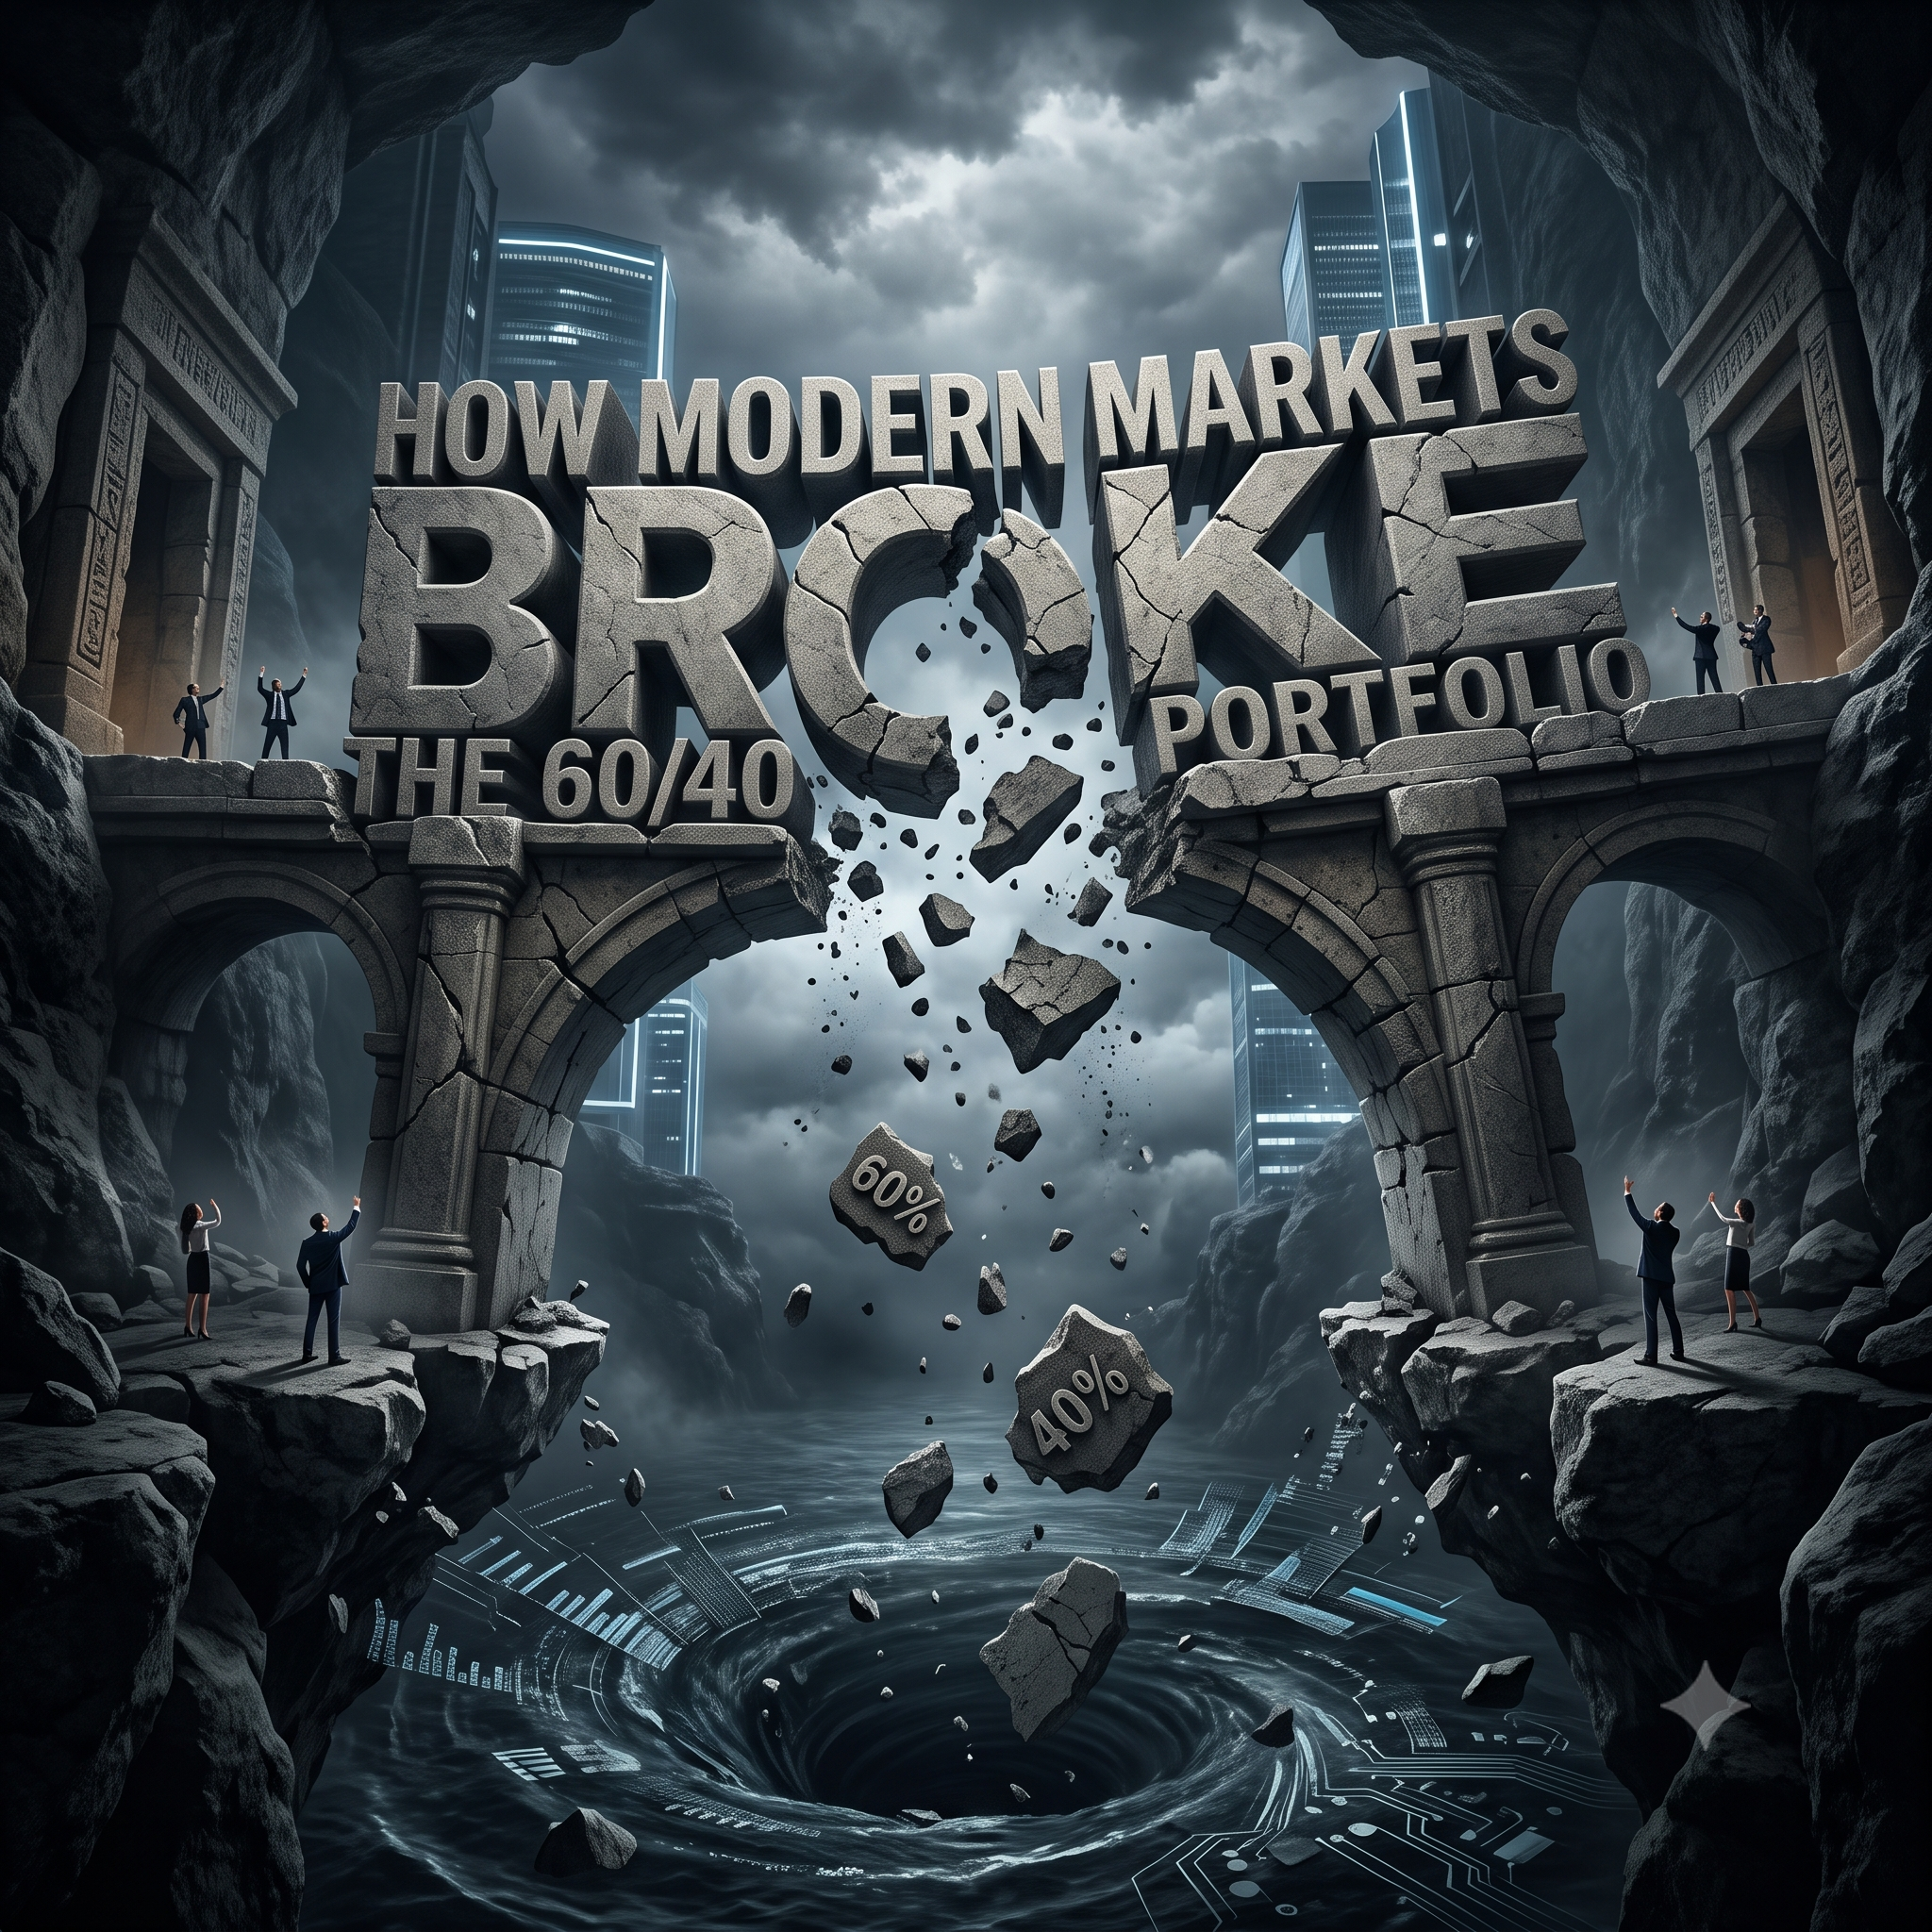
The classic 60/40 portfolio allocates 60% to stocks for growth and 40% to bonds for safety. The strategy is to buy-and-hold over the long term with some sort of periodic rebalancing.
The logic is that stocks will generate growth during economic expansions and bonds will provide a reliable buffer during recessions. In the past, when growth slowed, central banks would cut interest rates, driving bond prices up as stock prices fell. That ballast is now gone.
The 60/40 portfolio is no longer responding to the traditional business cycle. Instead, structural forces have caused both asset classes to decouple from their historic drivers, leaving investors exposed to a simultaneous breakdown in both growth and safety.
The 60% Problem: Equity Returns Driven by AI Concentration, Not Business Cycles
Historically, equity indexes reflected broad macroeconomic health—consumer spending, industrial production, corporate earnings growth, and employment trends. An investor buying an index fund was effectively betting on the broader business cycle.
Today, equity returns are dominated by extreme market concentration, driven primarily by the generative AI trade. A handful of mega-cap technology firms now account for an unprecedented percentage of major indexes like the S&P 500.
As a result, stock market performance has detached from economic fundamentals. High interest rates, softening consumer sentiment, and slowing GDP growth matter less to the market than capital expenditure announcements, semiconductor supply chains, and hyperscaler cloud revenue.
In today’s environment, the average stock can underperform or move sideways while index-level returns look robust, driven solely by a concentrated cluster of AI beneficiaries. Because equity returns are tied to high expectations around AI productivity and monetization rather than broad-based economic growth, any deceleration in tech capex or valuation compression leaves the 60% portion of the portfolio exposed to severe drawdowns—regardless of where we are in the broader economic cycle.
The 40% Problem: Bond Yields Driven by Fiscal Deficits, Not Rate Cuts
The traditional 40% bond allocation served as a built-in shock absorber, rallying whenever economic slowdowns prompted rate cuts. That mechanism is broken. Bond markets are no longer guided by monetary dominance responding to economic cycles, but by fiscal dominance driven by relentless government spending and debt supply.
Government debt levels in major economies are projected to climb toward 175% of GDP over the coming decades. With structural spending commitments, elevated debt-servicing costs, and persistent fiscal deficits, government bond supply is soaring at a time when traditional buyers (such as central banks engaged in quantitative tightening) are stepping back.
Fiscal constraints are now over powering central banks. Even if an economic slowdown prompts central banks to cut short-term interest rates, long-term bond yields may stay elevated or even rise due to the sheer volume of Treasury issuance required to fund government debt.
High government debt levels raise long-term inflation concerns and force investors to demand higher term premium—the extra yield required to hold long-term debt. Bonds no longer reliably rally during equity sell-offs if the sell-off is accompanied by inflation or fiscal stress. Instead of cushioning equity losses, bond yields can rise (and bond prices fall) simultaneously with equities.
Implications for Investors
The traditional 60/40 mix no longer provides automatic diversification and investors must reconsider how they build resilient portfolios. Navigating this environment requires moving beyond simple two-asset structures toward broader asset classes and active risk management.
Investors still using a passive, buy-and-hold strategy like 60/40 have been given a gift by the stock market. Fortunately for them, the AI cycle has kept stock prices near all-time highs. The 40% is already broken. When the AI bubble pops, the 60% will break and 60/40 portfolios will be crushed.
Last month I published our Q3 Investment Outlook: Navigating the Late-Stage Cycle, where I went into depth on how I’m investing for my clients. If you’re interested in learning what asset classes may help diversify your portfolio beyond traditional stocks and bonds, I think you’ll find it valuable. If you’d like to review your investments or want a complimentary analysis of your current portfolio, contact me anytime.
◇ ◇ ◇
Market Forces: A deeper dive...
Jeffrey Gundlach, “The Bond King,” explains the forces driving Treasury yields. Pointing to growing stress in corporate credit and fiscal pressures, Gundlach continues to advocate for high credit quality, avoiding the long end of the yield curve.
Treasury Secretary Scott Bessent’s historic intervention to prop up the Japanese yen, reflects his hedge fund trading background, now being applied to government policy—a dangerous precedent that treats the U.S. Treasury like a private investment firm.
Patrick Doyle exposes big tech’s $1.65 trillion in hidden off-balance-sheet debt, disclosed in places too tedious for most people to read. If the massive debt overhang doesn’t pop the AI bubble, the missing revenue will.
Why are hyperscalers hiding their AI revenue? Analyst estimates suggest that 70% of Microsoft, Google and Amazon’s AI revenues come from unprofitable money furnaces, OpenAI and Anthropic. Tech reporter Ed Zitron and Prof G Markets’ Ed Elson discuss recent tech earnings and what they mean for the future AI companies.
Driven by career incentives and fear of peer retaliation, corporate leaders are forcing an enterprise "AI mania" that relies on hollow hype rather than real operational gains. Blanket corporate mandates fail to deliver promised cost savings and instead force employees to fake adoption to survive.
◇ ◇ ◇
Off the beaten path...
President Trump is selling early access to his social media posts. The price tag is reportedly up to $100,000 a month, which only Wall Street can afford, raising insider trading concerns.
New home prices have moved back above the affordability threshold. The average mortgage payment on the typical new home sold in the U.S. is back above the upper limit of affordability for the typical American household.
Matt Taibbi breaks down how the federal government censored critics of the official COVID narrative, and how the media ignored the story even after the government lost the fight in court.
Andrew Luck could have been the greatest quarterback in NFL history, if the Colts would have protected him. He remains a great role model with an inspiring life story.
◇ ◇ ◇
When you're ready, here's how I can help:
Review your investments. Your "buy-and-hope" portfolio presents a serious risk to your retirement plan. I'll review your holdings one-by-one and share ideas for how to de-risk.
Free portfolio analysis. Get a comprehensive portfolio analysis with Portfolio Visualizer, an institutional-grade tool that measures portfolio risk, volatility and diversification gaps.
Free Retirement Planning Tool. I've partnered with ProjectionLab, a simple but detailed financial planning tool that will reduce anxiety around your finances.
Learn how we invest for clients. Every quarter we provide clients with a detailed Investment Outlook that explains exactly how they're invested and why.
Thanks for reading. I'd love to hear from you!
I founded Alpha Rock to provide investors the highest level of personal service. Discover the benefits of working with a solo advisor and contact me directly with your thoughts, questions and feedback.

IMPORTANT DISCLOSURE INFORMATION
This commentary reflects the personal opinions, viewpoints and analyses of the Alpha Rock Investments, LLC employees providing such comments, and should not be regarded as a description of advisory services provided by Alpha Rock Investments, LLC or performance returns of any Alpha Rock Investments, LLC client. The views reflected in the commentary are subject to change at any time without notice. Nothing in this commentary constitutes investment advice, performance data or any recommendation that any particular security, portfolio of securities, transaction or investment strategy is suitable for any specific person. Any mention of a particular security and related performance data is not a recommendation to buy or sell that security. Alpha Rock Investments, LLC manages its clients’ accounts using a variety of investment techniques and strategies, which are not necessarily discussed in the commentary. Investments in securities involve the risk of loss. Past performance is no guarantee of future results.
The S&P 500 Index or the Standard & Poor's 500 Index is a market-capitalization-weighted index of the 500 largest U.S. publicly traded companies. The S&P 500 is a float-weighted index, meaning company market capitalizations are adjusted by the number of shares available for public trading. Note: Investors cannot invest directly in an index. These unmanaged indices do not reflect management fees and transaction costs that are associated with most investments.
Alpha Rock Investments, LLC provides links for your convenience to websites produced by other providers of industry related material. Accessing websites through links directs you away from our website. Alpha Rock Investments, LLC is not responsible for errors or omissions in the material on third party websites, and does not necessarily approve of or endorse the information provided. Users who gain access to third party websites may be subject to the copyright and other restrictions on use imposed by those providers and assume responsibility and risk from use of those websites.